Risk Register Development
By David Hulett
Purpose of Risk Registers
Risk registers provide project managers with a list of risks identified, stated clearly and assessed as to their importance to meeting project objectives. The risk register can lead directly to risk handling, such as risk mitigation. The risk register is also used in a focused quantified risk analysis such as schedule risk analysis based on driving the Monte Carlo simulation with specific risks. This latter use is called the Risk Driver Method of schedule and cost risk analysis.
Identifying Risks
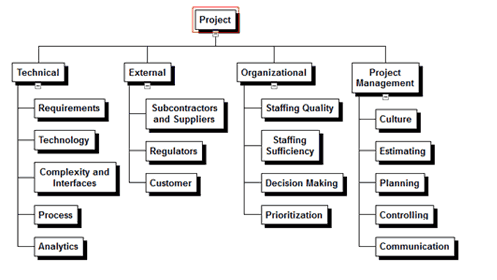
The risk register starts with a list of risks that may affect the project’s ability to achieve its objectives. Risk identification starts with the risk breakdown structure. Often there is a discussion between the risk consultant and the project leadership including the project manager and team leadership about where the risks to the project may originate. A generalized risk breakdown structure is shown below:

The purpose of the risk breakdown structure (RBS) is to encourage people to think of risks that may originate outside of their “stovepipe.” Most people will think of the specific risks, often technical risks, that are impeding their getting their specific assignment done, and it is good to identify those risks. However, project team members have been involved with the project and have seen risks to success arising from other causes. In particular, external elements including regulators or the customer may be causing problems with the project. And there are barriers to success from the performing organization as well. These particular risks may be unpopular to discuss and to recognize, so the RBS helps people confront those sources of risks.
The risks should be discussed in a structured way, such as: “Because of (some cause that is true), a risk (an uncertain event or condition that, if it occurs will affect an objective in a positive or negative way), leading to (an impact, sometimes a range of possible impacts on a project objective). Distinguishing a risk from its cause and impact is important so that a mitigation of the true risk can be developed. For instance, do not say; “We have 12 schedule risks.” We might say, we have 4 external risks that affect schedule if they were to occur, distinguishing the source of the risk from its impact. Also, do not say; “Our risk is that the mineral deposit is in an inaccessible location in a mountainous jungle.” That fact may be a cause of logistical risks, but it is not an uncertainty at all.
We do include so-called “uncertainties,” risks that are 100 likely to happen but with uncertain impacts. Hence, there is uncertainty to these risks, just not to their occurring or not.
Defining the Terms for Qualitative Risk Analysis
The discipline of assessing the probability and impact of a risk on a project depends on defining the terms used and them applying those terms to each risk assessed. Someone in authority, probably the project manager who is responsible for delivering the project objectives, needs to provide these definitions. The terms defined include:
- Probability the risk will occur with some noticeable impact on the project. The project manager needs to determine which probabilities would be scored between very low to very high, inclusive.
- The definitions of impact should be set by the Project Manager for the levels of very low, low, moderate, high and very high impact, by objective (time, cost, scope and quality).
- The structure of the probability – impact matrix is also the responsibility of the project manager. That means which combinations of probability and impact will cause a risk to be assessed red, yellow or green.
The probability measures such as those shown below will serve, but sometimes the project leadership wants to provide more detail in the lower (‹ 50%) probabilities:
| Probability % | Score |
|---|---|
| Very High (81 - 100) | 5 |
| High (61 - 80) | 4 |
| Mod (41 - 60) | 3 |
| Low (21 - 40) | 2 |
| Very Low (1 - 20) | 1 |
The impact scales are applied to individual risks. Looking at the definitions, we recognize, that successful overall project delivery is affected by many individual risks and that if any one of them would cause a 1-month delay or an increase of $100,000 it would be deemed to have a high-impact. On quality and scope “very high” impacts result if the risk makes the “project end item is effectively useless”. For a large, lengthy project such as the construction of an oil refinery the definitions may be something like these:1
| Defined Conditions for Impact Scales of a Risk
on Major Project Objectives Examples for Negative Impacts Only |
|||||
|---|---|---|---|---|---|
| Project Objective | Cost | Time | Scope | Quality | Score |
| Very Low | Less than $100,000 | $100,000 - $250.000 | $250,000 - $500,000 | $500,000 - $1,000,000 | Greater than $1,000,000 |
| Low | Insignificant Time increase | Less than 1 month | 1 - 2 months | 2 - 4 months | Greater than 4 months |
| Moderate | Scope Decreases are barely Noticeable | Minor Areas of Scope Affected | Major Areas of Scope Affected | Scope Reduction Unacceptable to Customer | Project End Item is Effectively Useless |
| High | Quality Degradation Barely Noticeable | Only Very Demanding Applications are Affected | Quality Reduction Requires Customer Approval | Quality Reduction Unacceptable to Customer | Project End Item is Effectively Useless |
| Very High | 1 | 2 | 3 | 4 | 5 |
Notice that we provide defined impacts for each of the project objectives. In many risk register exercises the participants just try to assess risk to the entire project. That is too vague and does not answer the question: “What are the main (red) risks to my schedule?” “What is likely to affect my ability to achieve the scope I have committed to deliver?” Only if the risks are assessed against specific objectives will there be clarity in the exercise and usefulness in the results. We often find, for instance, risks to schedule that have little impact on cost and no impact on scope or quality.
Often there are attempts at risk analysis that do not use any definitions at all, assuring management that “we will be able to distinguish high impact from moderate impact when we see it.” This approach is bound to fail, and any Risk Register based on this approach cannot have any credibility.
In addition, the probability and impact matrix is developed by the project manager and will be used to determine which combinations of probability and impact would warrant a risk being assessed as “low” “moderate” or “high”. A representative matrix is shown below for threats:
| Probability and Impact Matrix for an Objective
(e.g., Time, Cost, Scope, Quality) |
||||||
|---|---|---|---|---|---|---|
| Probability (%) | Prob. Score | Impact | ||||
| Very High (81 - 100) | 5 | 5 | 10 | 15 | 20 | 25 |
| High (61 - 80) | 4 | 4 | 8 | 12 | 16 | 20 |
| Mod (41 - 60) | 3 | 3 | 6 | 9 | 12 | 15 |
| Low (21 - 40) | 2 | 2 | 4 | 6 | 8 | 10 |
| Very Low (1 - 20) | 1 | 1 | 2 | 3 | 4 | 5 |
| Impact Score | 1 | 2 | 3 | 4 | 5 | |
| Very Low | Low | Moderate | High | Very High | ||
There are also opportunities. Opportunities are those uncertainties that, if they occur, will help the project achieve its objectives. We should look for opportunities or we will never find them, since most people think of risk as the possibility of bad things (scope shortfalls, cost or schedule overruns) occurring. There are usually more threats than opportunities.
These assessments provide relative rankings particularly of impacts. It is not true that a “high” impact with a score of 4 can be described as being twice as impactful as a “low” impact with a score of 2. However, multiplying the probability and impact scores does put the risks in the right cells. Hence, a conditional formatting in a spreadsheet might show:
- Any score below 5 is green or low risk to the objective in question
- Any score between 5 and 10 is yellow or moderate risk to the objective
- Any score above 10 is red or high risk to the objective (notice the “10” in the right-hand column is red. We can fix this by scoring “very high” impacts as 5.1 and the rule will apply.)
Collecting Data for the Risk Assessments
- Workshops usually involve many participants who discuss the risks individually and arrive at a consensus conclusion about impact and probability. If there are many risks, for instance more than 50, the participants can be formed into teams of 4 or more, and each assigned to provide assessments of a portion of the risk list. If this is the approach, each team should report back to the entire workshop for discussion and confirmation or adjustment of their assessment.
- Individual interviews require team members to meet individually with the facilitator to provide their input probability and impact assessment on those risks they feel comfortable discussing. In this approach multiple different assessments are gathered for most of the risks and the facilitator needs to review these to arrive at one specific probability and impact value for each risk.
There are benefits and limitations of each of these methods. The first factor to consider is that the qualitative assessment of risks’ probability and impact relies on the project team’s expert judgment. This is why one needs to be careful in choosing the participants and also to encourage them to contribute about a risk only if they feel comfortable in doing so.
- Workshops can contribute to a rich discussion of the risks that will get people thinking of new facts or concepts to consider. Sometimes, however, the workshop can be hijacked by a strong personality or someone in authority, and others in the workshop may feel it is better not to voice their own concerns. People have been criticized from mentioning risks that are true but sensitive in nature, such as those risks involving the customer or a lack of qualified people in the performer’s organization. Also, if there are 20 people in a 1-day workshop, some 160 staff hours are used, with many of those hours focusing on a few individuals’ ideas.
- Interviews take longer in calendar time than workshops but they can unearth important risks that might not be discussable in a workshop. Usually confidentiality is pledged so that an individual’s contributions are never identified as coming from that individual. A difficulty of this approach is that several people will comment on an identified risk and have different opinions that ultimately have to be consolidated into one probability and one impact. If there are 20 people and the interviews take on average 2 hours each, approximately 40 staff hours will be expended on this exercise, although the hours of the facilitator will be greater than it is with the workshop approach.
Pre-Mitigation Risk Register Results
The identified risks with names and source areas (from the Risk Breakdown Structure) could be shown in a spreadsheet with conditional formatting (red, yellow or green) as shown below.
The risks can be described individually or sorted by objective or source. Below the risks are sorted by their impact on schedule (we have eliminated the Quality columns to make the presentation feasible.)
| Probability and Impacts | Resulting Risk Score | Risk Action | |||||||
|---|---|---|---|---|---|---|---|---|---|
| Risk Description | Probability Risk Occurs | On Schedule | On Cost | On Scope | Risk on Schedule | Risk on Cost | Risk on Scope | Risk Owner | Risk Mitigation Actions |
| PM5 | 4 | 5 | 4 | 3 | 18 | 15 | 10 | ||
| TECH2 | 4 | 5 | 4 | 3 | 17 | 16 | 13 | ||
| ORG6 | 3 | 4 | 3 | 3 | 14 | 11 | 10 | ||
| EXT12 | 3 | 5 | 4 | 3 | 13 | 12 | 10 | ||
| ORG5 | 3 | 4 | 3 | 3 | 13 | 9 | 8 | ||
| ORG9 | 3 | 4 | 3 | 3 | 13 | 10 | 9 | ||
| EXT5 | 3 | 4 | 3 | 2 | 12 | 11 | 7 | ||
| PM3 | 3 | 4 | 4 | 3 | 12 | 12 | 8 | ||
| TECH15 | 2 | 5 | 5 | 3 | 12 | 12 | 7 | ||
| TECH6 | 3 | 5 | 4 | 3 | 12 | 10 | 7 | ||
| PM1 | 3 | 4 | 3 | 2 | 11 | 8 | 7 | ||
| TECH1 | 3 | 3 | 3 | 3 | 10 | 11 | 10 | ||
| EXT1 | 2 | 4 | 3 | 3 | 7 | 7 | 5 | ||
| TECH5 | 2 | 4 | 3 | 3 | 6 | 6 | 6 | ||
| EXT4 | 2 | 4 | 4 | 2 | 6 | 5 | 3 | ||
| PM7 | 3 | 2 | 4 | 2 | 6 | 12 | 6 | ||
| TECH14 | 1 | 5 | 5 | 2 | 5 | 5 | 2 | ||
| TECH8 | 1 | 5 | 3 | 1 | 5 | 3 | 1 | ||
| EXT9 | 1 | 3 | 3 | 1 | 3 | 3 | 1 | ||
| TECH3 | 1 | 3 | 3 | 1 | 3 | 3 | 1 | ||
This sort of the Risk Register answers the question; “What are the most important risks to my schedule?”
Risk Owner, Mitigations and Post-Mitigation Risk Register Assessments
To be taken seriously, certain actions are needed before the Risk Register is considered done:
-
Assign a risk owner to each risk
The risk owner is responsible for getting people together to identify and plan risk mitigation steps. The risk owner does not need to be the owner of the risk mitigation action but he or she needs to be responsible to see that the action is identified, planned (including cost, resources, timing and approvals if needed), implemented and monitored for effectiveness -
Identify and plan risk mitigations, at least for the high or red risks
Mitigation actions often take money and resources and sometimes take top management approvals. Some risks will be managed by more than one mitigation step. The mitigation measures need to be specific and actionable, appropriate to the risk and reasonably likely to be effective. Implement the risk mitigation actions On some projects risk mitigations are discussed but never implemented
Risk mitigations need to be planned, budgeted, staffed, scheduled and managed like any other important project activity.Assess the risks’ probability and impact after mitigation, using the same discipline and definitions that have been used to rank the risks initially
A comparison can be made with the pre-mitigated risk scores to see how effective the team thinks the mitigations will be.
It is possible that even after mitigation there will still remain risks judged to be high or red risk, especially to the schedule. In some industries projects go ahead with red risks, where in other industries there can be an expectation that red risks can be mitigated to yellow or green conditions.
- 1Obviously the project manager needs to tailor the definitions to the specific project.


