Project Schedule Risk is Key to Understanding Cost Risk1
By David Hulett
We have always heard that “time is money.” That is true for projects that are conducted, in part, using resources like labor or rented equipment that will cost more if they work longer. However, this fact has not been well implemented in project cost estimating until recently. In fact, many cost estimates assume that the project schedule is engraved in stone, whereas the schedule may be the most risky component of the project.
A risk analysis of the cost estimate is conducted using the resource-loaded project schedule where the project budget (without any embedded contingency amounts) is assigned to the schedule activities they support. Then, the schedule is simulated using Monte Carlo techniques wherein:
- The time-dependent costs cost more if their activities take longer because of risks to schedule. These include labor-type resources assigned to the activities and supporting resources such as the project management team that work until the schedule is complete. These resources are often placed on hammock tasks rather than work tasks in the schedule.
- Time dependent costs may be uncertain even if the schedule is fixed since the daily “burn rate” may vary for reasons of hourly rates or uncertain resource loads.
- Time independent costs such as purchased equipment or raw materials may be uncertain but not because of time.
Using this framework the Monte Carlo simulation of resource-loaded and costed schedules will produce estimates of completion dates and costs that are internally consistent. This means that any iteration will assume the same configuration of risks (whether they occur and the degree of their impact) to calculate the dates and total project cost.
The Project Schedule is the Platform for Both Schedule Risk and Cost Risk Analysis
The platform for the integrated cost-schedule risk analysis is a cost-loaded CPM schedule. To incorporate the schedule risk into the cost risk the schedule has to be taken into account directly and transparently. A simple construction schedule at a very high summary level is used to show the platform. Notice that the cost of $624 million is already in the schedule:

Resources are placed in the schedule by being assigned to the activities. We use summary resources that are not detailed enough to develop spend curves by discipline or to level resources, but are useful to help us distinguishing between:
- Time-dependent resources such as labor and rented equipment (think of drill rigs) that cost more if their activities take longer
- Time-independent resources such as materials and procured equipment that may have risky costs but not because of duration
| ID | Description | Type | Default Loading |
|---|---|---|---|
| COMM | Commissioning | Labor | Normal |
| CONS | Construction | Labor | Normal |
| ENG | Engineers | Labor | Normal |
| ENV | Environmental | Labor | Normal |
| MGT | Management | Labor | Normal |
| PMT | Project Management Team | Labor | Normal |
| PROC | Procurement | Materials | Spread |
Applying the resources to the schedule assigns costs to each activity:
| Cost Estimate by Resource and Activity ($ thousands) | ||||||||
|---|---|---|---|---|---|---|---|---|
| ACTIVITY | PMT | MGT | ENV | ENG | PROC | CONS | COMM | Total |
| Approval | 720 | 1350 | 2,070 | |||||
| Environmental | 900 | 4500 | 5,400 | |||||
| Design | 6,000 | 40,000 | 46,000 | |||||
| Procurement | 10,800 | 200,000 | 210,800 | |||||
| Install Equipment | 2,250 | 5,400 | 7,650 | |||||
| Construction | 13,800 | 322,000 | 335,800 | |||||
| Commissioning | 1,500 | 15,000 | 16,500 | |||||
| Total | 35,970 | 1,350 | 4,500 | 40,000 | 200,000 | 327,400 | 15,000 | 624,220 |
Risk Drivers Method
We are using the Risk Drivers method to drive the Monte Carlo simulation. Starting with the Risk Register we perform interviews of the project team members and determine the risk parameters needed:
- The probability that the risk will affect the durations of some activities in the schedule
- The impact range in multiplicative terms of the risk, if it occurs
- The uncertainty in the cost of time-independent resources such as raw materials and purchased equipment
- The cost risk for time-dependent risks is affected by two general forces:
- The uncertainty in duration of the activities
- The daily “burn rate” of the resources. In other words, even if the schedule is perfect there may still be uncertainty in the cost of time-dependent resources.
A simple table showing these data as they might evolve from the risk interviews is shown below:
| Duration Impact Ranges (%) | Cost Impact Ranges (%) | |||||||
| Risk ID | Risk Description | Prob | Min | M L | Max | Min | M L | Max |
| 1 | S/C - Design Complexity may Challenge Engineers | 40 | 90 | 110 | 135 | 100 | 105 | 110 |
| 2 | S -Site Conditions / Site Access may Slow Logistics | 50 | 100 | 110 | 125 | |||
| 3 | S/C-Equipment Suppliers may be busy | 60 | 100 | 105 | 120 | 100 | 110 | 120 |
| 4 | S - Capable Management may not be Assigned | 40 | 90 | 105 | 115 | |||
| 5 | S -Environmental Agency May be Slow | 50 | 95 | 110 | 135 | |||
| 6 | S - Activity Duration Estimates is Inaccurate | 100 | 90 | 105 | 115 | |||
| 7 | C - Cost Estimate is Inaccurate | 100 | 95 | 105 | 115 | |||
| 8 | S/C Key Engineering Personnel may be Unavailable | 65 | 95 | 105 | 120 | 90 | 100 | 110 |
The Schedule Risk Analysis Results
These results are the same with or without the resources and costs having been added. A sample histogram and S-curve of the results for the completion date is shown below:
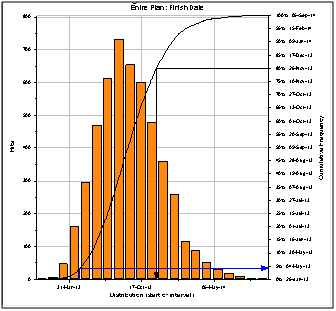
The difference between April 29, the completion date from the static CPM schedule, and the November 26 date from the 80th percentile (P-80) of the simulation could be used as a schedule contingency reserve. One way to look at it is that the baseline and the contract says the finish date is April 29 but the organization promises to complete by the risk analysis result, November 26, almost 7 months later.
The Cost Risk Analysis Developed from the Integrated Cost-Schedule Analysis
The main benefit of calculating the costs with the same assumptions that drive schedule dates is that cost uncertainty is now determined by uncertain time. The cost risk results are shown below and help the organization develop the appropriate cost contingency reserve. That reserve might be the difference between the baseline cost of $622 million and the P-80 of cost from the Monte Carlo simulation, shown below to be $793 million or about $170 million more:
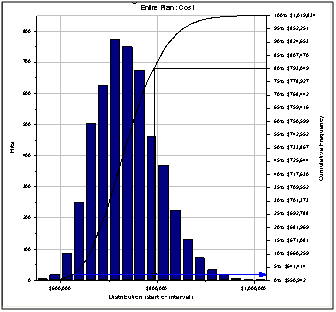
It is interesting to see the degree to which cost risk is driven, even dominated, by risks that are usually thought of as affecting project schedule. In some cases the so-called “schedule risks” are more important in determining project cost risk than are those risks (like market forces) that are usually thought of as determining project cost. An illustrative simple case study resulted in the table below, which shows that in this instance so-called schedule risk is actually responsible for $103 million of the cost risk while traditional risks to cost contributed only $78 million:
| Decompose the Cost Contingency at the P-80 | ||
|---|---|---|
| P-80 | Marginal Impact | |
| ($ millions) | ||
| Contingency-Free Cost Estimate | 624 | |
| All Risks | 793 | |
| Cost Risks Only | 702 | 78 |
| Schedule Risks Only | 727 | 103 |
| Total Contingency All Risks | 169 | |
| Note: Amounts do not add at P-80, only at means | ||
Prioritizing Risks to Schedule and to Cost for Risk Mitigation
Usually the project management and the customer do not want the risk analyzed P-80 date or cost to occur, since that often represents overruns and customer dissatisfaction. Risk mitigation is in order. Having used the Risk Driver Method to drive the simulations, it is now possible to identify the specific risks that lead to project schedule or cost risk. Schedule risks are identified in priority order in the table below:
| Priority Schedule Risks | |||
|---|---|---|---|
| Risk ID | Risks | P-80 Date | Contribution to the P-80 Contingency |
| ALL RISKS INCLUDED | 27-May-14 | (Days) | |
| Risks Removed | |||
| 9 | S/C - May have Problems during Commissioning | 13-Nov-13 | 195 |
| 8 | S/C Key Engineering Personnel may be Unavailable | 4-Oct-13 | 40 |
| 6 | S - Activity Duration Estimates is Inaccurate | 18-Aug-13 | 47 |
| 2 | S -Site Conditions / Site Access may Slow Logistics | 6-Jul-13 | 43 |
| 1 | S/C - Design Complexity may Challenge Engineers | 19-Jun-13 | 17 |
| 3 | S/C-Equipment Suppliers may be busy | 30-May-13 | 20 |
| 4 | S - Capable Management may not be Assigned | 6-May-13 | 24 |
| 5 | S -Environmental Agency May be Slow | 29-Apr-13 | 7 |
It is true that each risk makes the contribution to the contingency shown on the right-hand column only if they are eliminated from the simulation (probability set to zero) in the order shown. That is, without eliminating Risk 8 and saving 40 days, Risk 6 is not as important. However, after Risk 8 is eliminated, Risk 6 is exposed as the next most important risk and its elimination would save 47 days. This somewhat counter-intuitive result is derived from the parallel nature of the project schedule.
In this case study, the risks that influence the total project cost are shown below. Their designation of “S” or “C” indicates whether they are typically thought of as risks to schedule or cost. Confirming the importance of the schedule risks shown in the table above, it is interesting to see that there are several “S”-designated risks that are important to project cost risk.
| Priority Cost Risks | |||
|---|---|---|---|
| Risk ID | Risks | P-80 Cost | Contribution to the P-80 Contingency |
| ALL RISKS INCLUDED | 829.5 | ||
| Risks Removed | |||
| 7 | C - Cost Estimate is Inaccurate | 788.3 | 41.2 |
| 9 | S/C - May have Problems during Commissioning | 750.4 | 37.9 |
| 8 | S/C Key Engineering Personnel may be Unavailable | 719.1 | 31.3 |
| 2 | S -Site Conditions / Site Access may Slow Logistics | 687.7 | 31.4 |
| 6 | S - Activity Duration Estimates is Inaccurate | 664.6 | 23.1 |
| 3 | S/C-Equipment Suppliers may be busy | 641.7 | 22.9 |
| 4 | S - Capable Management may not be Assigned | 632.6 | 9.1 |
| 1 | S/C - Design Complexity may Challenge Engineers | 625 | 7.6 |
| 5 | S -Environmental Agency May be Slow | 624.2 | 0.8 |
Correlation Between Time and Cost
Another benefit is that we can look at the combined time – cost results from the simulation to understand how the risks to overall cost and schedule are related. This is done by examining a scatter plot of time and cost risk results from the simulation, as shown below:
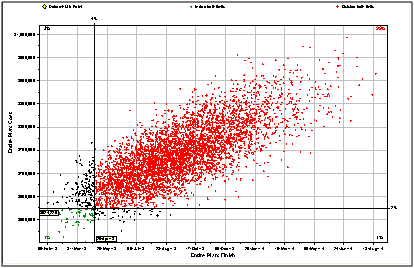
The scatter chart shows that there is almost no chance of meeting both cost and schedule objectives, a 95% chance of overrunning both of the objectives, and it calculates that time and cost are 77% correlated. Simply put, the high correlation of this simple made-up case study indicates how important the schedule risk is in determining cost risk. Not all real projects display such a high time-cost correlation.
We need to analyze costs within the context of a project schedule in what has become known as “integrated cost-schedule risk analysis” because:
- The time-cost correlation is not small, and
- The risks to cost usually contain risks that drive costs because they drive schedule.
Conclusion
Integrating cost and schedule risk into one analysis based on the project schedule loaded with costed resources from the cost estimate provides both: (1) more accurate cost estimates than if the schedule risk were ignored or incorporated only partially, and (2) illustrates the importance of schedule risk to cost risk when the durations of activities using labor-type (time-dependent) resources are risky. Many activities such as detailed engineering, construction or software development are mainly conducted by people who need to be paid even if their work takes longer than scheduled. Level-of-effort resources, such as the project management team or QA/QC, are extreme examples of time-dependent resources, since if the project duration exceeds its planned duration the cost of these resources will increase over their budgeted amount.
- 1Summary of AACE International Recommended Practice No. 57R-09 Integrated Cost and Schedule Risk Analysis Using Monte Carlo Simulation of a CPM Model(AACE 2011)

